If you’re looking to acquire more customers in 2024, here’s the very first thing to do (in our most humble opinion): Assess precisely where your company is with respect to customer acquisition.
Alright, so that may not sound all that revolutionary or surprising. But how would you do that? How would you assess your company’s ability to acquire new customers?
What would you actually assess? Spoiler alert: Today we’re dropping a new (free) tool for exactly this. But let’s establish some context first and start with how most would try to score themselves.
They’d start with the most tangible results. “Let’s look at pipeline, conversions and revenue – how have we been doing? It’s all in the data, right? And the bottom line!” What kind of conclusions could you draw from looking at that? (Rhetorical question.)
This is at the core of why companies struggle with customer acquisition. Most are simply focused on the outcome of past and present marketing tactics.
And here’s the punchline: Companies don’t have a true system for customer acquisition, especially not one built for the realities of 2024. Most rely on lead gen or demand gen plus a sales team to get buyers through a funnel.
But that means companies are hoping for new customers as an outcome, not optimizing for acquisition. Ok, we’ll leave it at that for now. So what’s this new tool?
Well, first of all, it’s based on the formula, which again is based on three core elements: DISTRIBUTION x AHA MOMENTS x CORE VALUE
Or, more specifically: What is the primary distribution into our audience that builds consumption habits?
How can we drive our audience to aha moments around our brand narrative?
And how can we deliver the core value of our offering pre purchase?
But for assessment purposes, before we score our distribution, we look at overall engagement: To which degree are buyers engaging with what we put out there?
And then we add in actual acquisition at the end. So there are a total of five levers that are scored.
1. Engagement
2. Distribution
3. Aha moments
4. Core value
5. Acquisition
The Low Friction Acquisition Assessment involves a scale of 1-5 (from no results to compounding results) for each of these five levers.
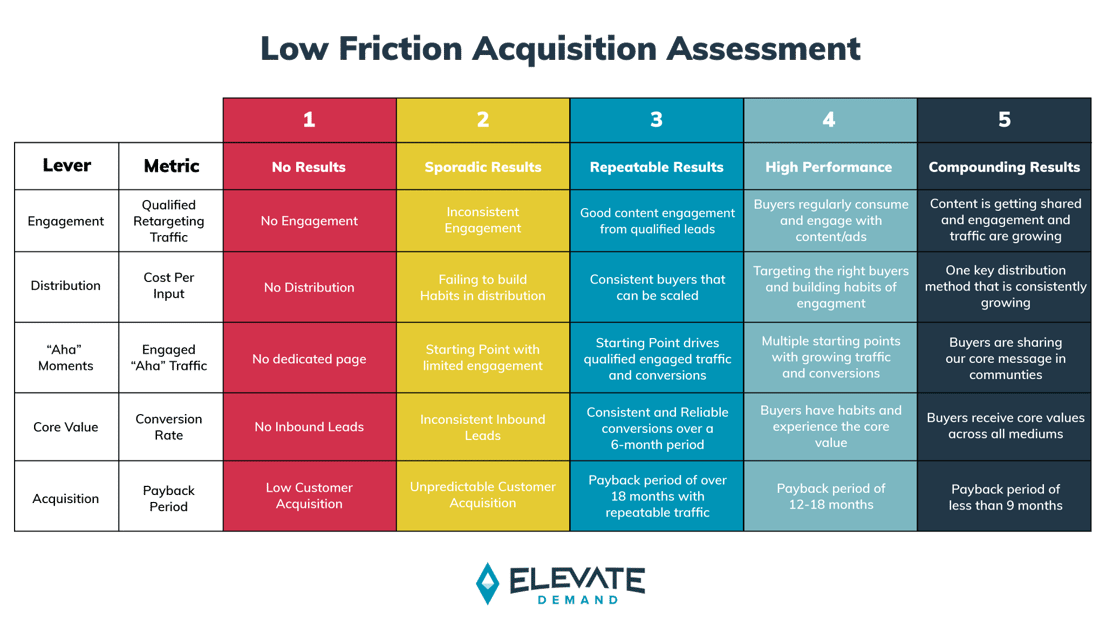
The scale is so important. It’s the crawl-walk-run stuff. While we all want to get to compounding results, we have to first get from no results to sporadic results. Then to repeatable results. And then to high-performing results.
And there are specific things we need to do for each step we’re trying to take up the scale – for each of the five levers. Without assessing ourselves like this, there’s no wonder why so many of us fall into the “more” trap.
The idea that we can just fire up some more campaigns or create some more content or add some more ad dollars. Nope, that’s not gonna do it.
The Low Friction Acquisition Assessment protects marketers against potentially wasting cycles, funds and resources. It protects us against the false struggle of marketing. And most importantly, it provides a framework for getting to compounding results.
We argue that’s the most important thing in marketing. But we also recognize that most of us are not even close to having that. In some ways, it feels like even moving from sporadic results to repeatable results would be a huge win. And it is. But it wouldn’t be enough.
We’ve already pointed out the crazy fact that CAC is increasing dramatically more than marketing budgets. And we just saw a post by Pavilion CEO Sam Jacobs saying the average payback period for SaaS businesses is now 48 months. So when you spend a buck, it will take you four years to get it back. Holy moly!
No wonder we’re all feeling pain right now. But from a marketing standpoint, there truly is only way out: Compounding results. We’ve been talking about that for a minute, but even to us, it didn’t feel quite clear how you’d achieve that until we came up with this acquisition assessment, which also acts as a much-needed maturity model for customer acquisition.
This maps out a system for acquisition, helps us see where we are and offers guidance as to our next moves. In marketing (and in life) it’s easy to get discouraged though.
It’s easy to look at the fact that we’re scoring mainly 2s and perhaps a couple of 3s and say “there’s no way we can get to 5s” – it’s human to react that way.
But we all have a real shot here. We can turn 2s into 3s, 3s into 4s and ultimately 4s into 5s.
Final thought on how to proceed: To some companies it might be more valuable to move from 3 to 4 on distribution, and for others it might be all about going from 1 to 2 on core value. We’re all a bit different. And this model isn’t linear.
Plus some of the levers are interlinked. It’s your job as a sharp marketing leader to see where the biggest opportunity (or constraint) is for, let’s say, Q1.
Focus on moving one lever at a time – one score at a time. If you wanna talk through it, we’re absolutely here for that.